The science of benchmarking: from Zero to Hero [Part I]

Evals are suddenly everywhere: company strategy, political decisions, advertising.
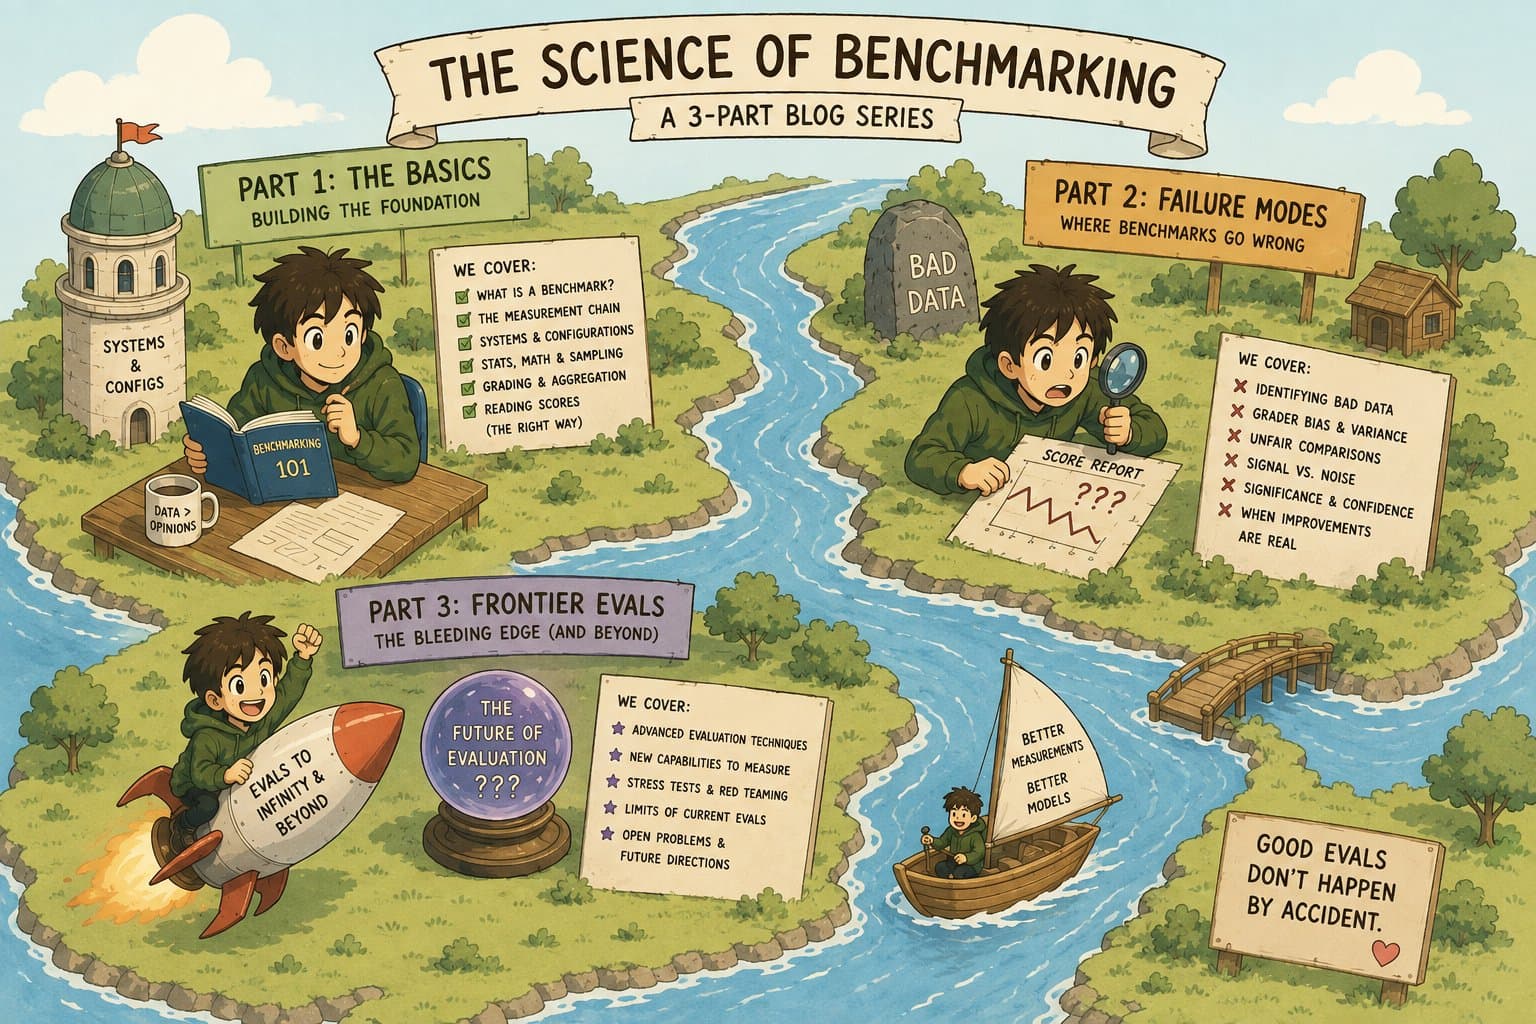
Yet there is surprisingly little material explaining the science behind them. This three-part series is my attempt to explain benchmarking from first principles.
We will start with the basics:
- Why benchmark? What question is an evaluation supposed to answer?
- What should we benchmark? Which tasks, users, environments, and capabilities should the data represent?
- How should we benchmark? How do metrics, sampling, uncertainty, and statistics turn into a score?
In Part II, we will go deeper into the ways benchmarks fail. We will look at stronger statistics, noisy data, unreliable graders, contamination, repeated trials, leaderboard gaming, and the tricks that we can use to have pretty score for the investors.
In Part III, we will move to the frontier: live and dynamic benchmarks, arenas, production evals, agent trajectories, adaptive testing, and the open problems teams at places like Arena, Braintrust, and Intelligence.ai are trying to solve.
Why do we Benchmark?
The short answer is that most of the things we care about are not directly observable.
Suppose I want to know whether a model is good at software engineering. There is no software_engineering_score inside the model that I can print out and say “72% good at debugging.” What I can do is give the system some work, observe what it does, decide whether the work was completed successfully, and use those observations as evidence.
Very roughly:
thing we care about → tasks we can observe → system behavior → grading → score → conclusion
A benchmark is an attempt to make that loop quick, reliable, and useful.
Some follow up questions you may ask are: If I say I want to measure “reasoning,” which tasks should count as reasoning? If the model gets the final answer right for the wrong reason, should that count? If another model gets the answer wrong because of a formatting mistake, should that count against its reasoning ability?
This is why I find it useful to think of benchmarks as measurement instruments rather than as collections of questions.
The thermometer is not the temperature. It is an instrument that produces an observation which, under the right assumptions, tells us something about temperature. Likewise, a benchmark score does not equal intelligence, reasoning, coding ability, safety, or any other capability. The score is an observation generated by an instrument that, under the right assumptions, tells us something about the underlying construct.
The farther the claim moves from the thing we directly observed, the more assumptions we are making.
Consider three statements:
This system resolved 47% of these repository issues.
This system is good at software engineering.
This system is generally intelligent.
The first is relatively close to what we can observe from a benchmark of certain repository issues (but still quite an underspecified statement). The second requires us to argue that the repository issues are representative of software engineering. The third requires several more leaps.
The first job of an eval is to support a claim.
A useful template is:
System S can complete task family X for population Y under conditions Z.
Being more precise, suppose X is a family of tasks, Y is the population we care about, and Z specifies the conditions under which the system operates. Then the thing we would ideally like to know is:
In words: if I draw a task from the population of work I care about, what is the probability that system S successfully completes it under conditions Z?
Unfortunately, we cannot usually see the entire population of work we care about. For example, we do not have access to every future software-engineering task, every customer request, or every reasoning problem the model might encounter.
So we build a benchmark. We sample some finite set of tasks and estimate that unknown quantity:
where
It follows that:
The entire science of benchmarking is, in some sense, about understanding when the thing on the right gives us useful evidence about the thing on the left. For example, we create a benchmark on software engineering in the hope that we will predict how good, in production, the model is going to be. A better benchmark is a better predictor for a precise claim.
When building a benchmark we should ask ourselves:
- What are we trying to learn?
- What system are we evaluating?
- What work should the tasks represent?
- What decision will the result inform?
- What should the score not be used to claim?
So, again, why benchmark?
Because we need evidence to make decisions about systems we cannot understand by inspection alone.
What is a benchmark?
Once we know what question we are asking, we need to turn it into something observable / actionable.
That process has a few pieces:
tasks → system → outputs → grader → metric → score
(T) A task is one unit of work.
For a simple math benchmark, a task might be:
{
    "id": "math_017",
    "prompt": "What is 17 × 6?",
    "reference_answer": "102"
}
For a coding agent, a task can be much larger: an initial repository, an issue description, access to a terminal, and some conditions defining successful completion, an example is seen in the original SWE-Bench paper.
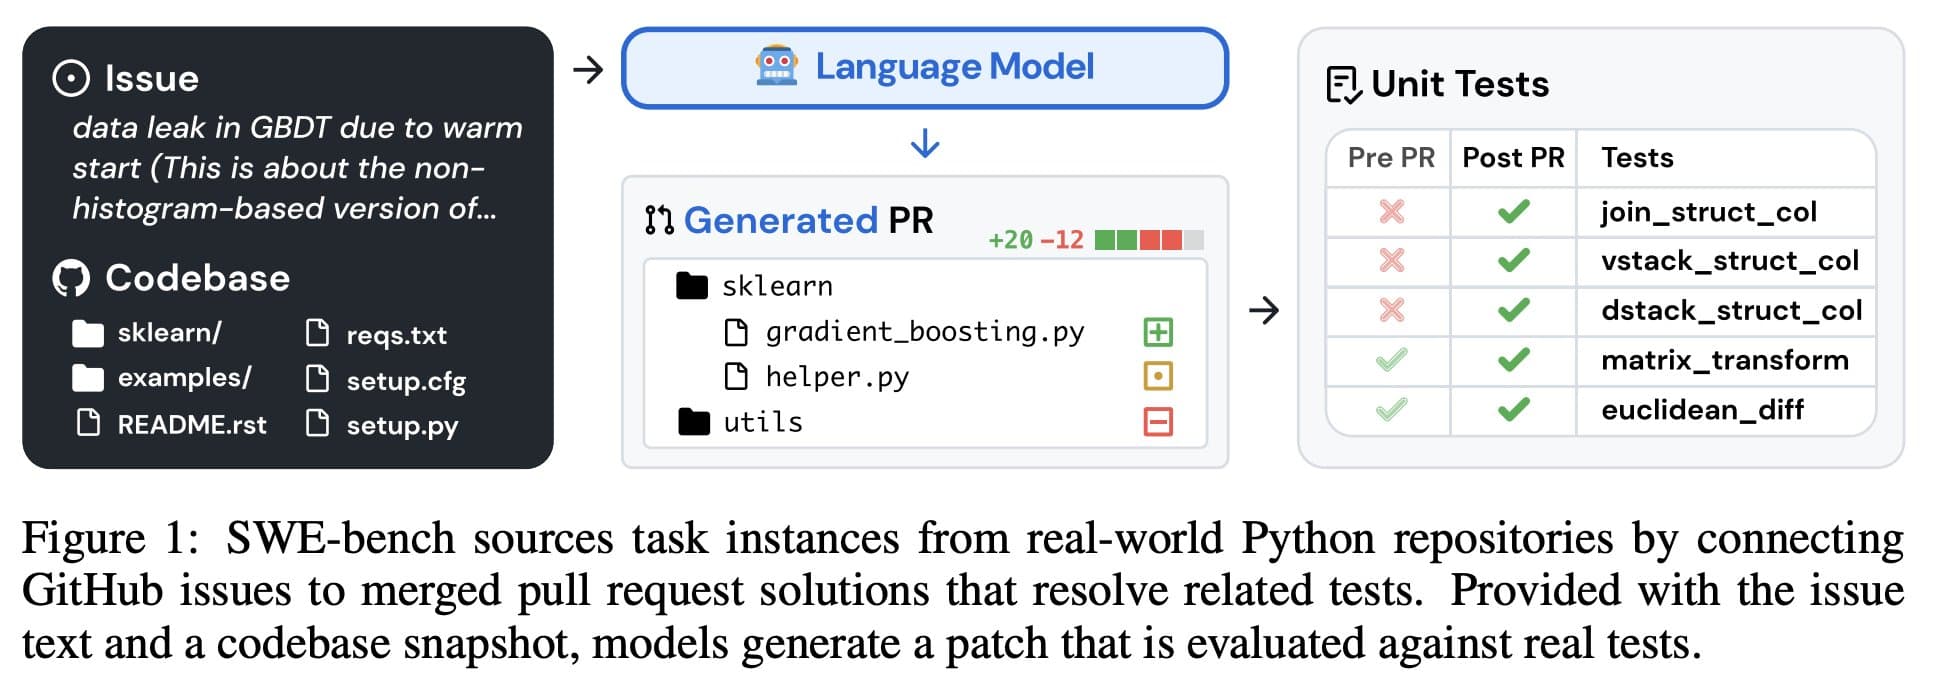
In this case, we move from “complete this function” to “resolve this issue in a real repository” introducing repository navigation, dependency understanding, editing across files, running tests, and iterating on failures. So we are no longer measuring only whether the model can generate a few correct lines of code. The "task" has a higher level of complexity, usually followed by a higher level of dependencies and confounders.
(D) A dataset is a collection of those tasks.
Sometimes the dataset is static. Sometimes tasks are generated dynamically. Sometimes there are train, validation, and test splits. But conceptually it is the set of observations we have chosen to make.
The word there is chosen. A dataset is never simply “the world.” It is a sample of some much larger space of possible work. We will come back to this in Part II because sampling turns out to be one of the most important parts of benchmark design.
(G) A grader
After the system does the task, something has to determine what happened.
For a simple exact-answer task a grader can look like:
def grade(prediction, reference):
    return prediction.strip() == reference.strip()
There are different flavors of this. For a repository task, the grader might run tests. For a writing task, it might be a human evaluator or an LLM judge (ie. an LLM whose asked to grade something). For an agent acting in an environment, the grader may inspect the final state of that environment.
This component goes by several names: grader, evaluator, or verifier.
The grader is not reality. It is another part of the measurement instrument.
The grader is part of the system and can itself fail. If the grader accepts bad work, the benchmark records false success. If it rejects valid work, the benchmark records false failure. Again, we will spend a lot of time on this in Part II.
(M) A metric
Finally, we need to aggregate outcomes. Suppose we evaluate N tasks and record:
Then the simplest benchmark score is just the average:
Then, if the model passes 74 out of 100 tasks:
or 74%. Now we can put the pieces together.
What is a benchmark?
Definition:
A benchmark is a set or generator of tasks (T), together with a protocol for running systems (S), a way of judging outcomes (G), and a metric for summarizing those outcomes (M).
Then an evaluation is one particular experiment using that benchmark:
Benchmark version + system configuration + evaluation protocol + outputs + task-level results = evaluation
And a leaderboard is simply a way of reporting many such evaluations next to one another.
Assuming that all the machinery is implemented correctly (spoiler: it is actually pretty hard) we still have to decide what tasks to put into the benchmark in the first place.
What are we benchmarking?
Suppose 70% of what your users ask for is small bug fixes, 20% is code explanation, and 10% is larger refactors.
Now suppose your benchmark contains:
- 10% small bug fixes
- 10% code explanation
- 80% difficult multi-file refactors
You may have built a very hard benchmark. You may even have built a great benchmark for separating frontier coding agents.
But you have not built a representative benchmark of your users. The benchmark and production traffic are now different distributions, so the score is a worse predictor of what users will actually experience.
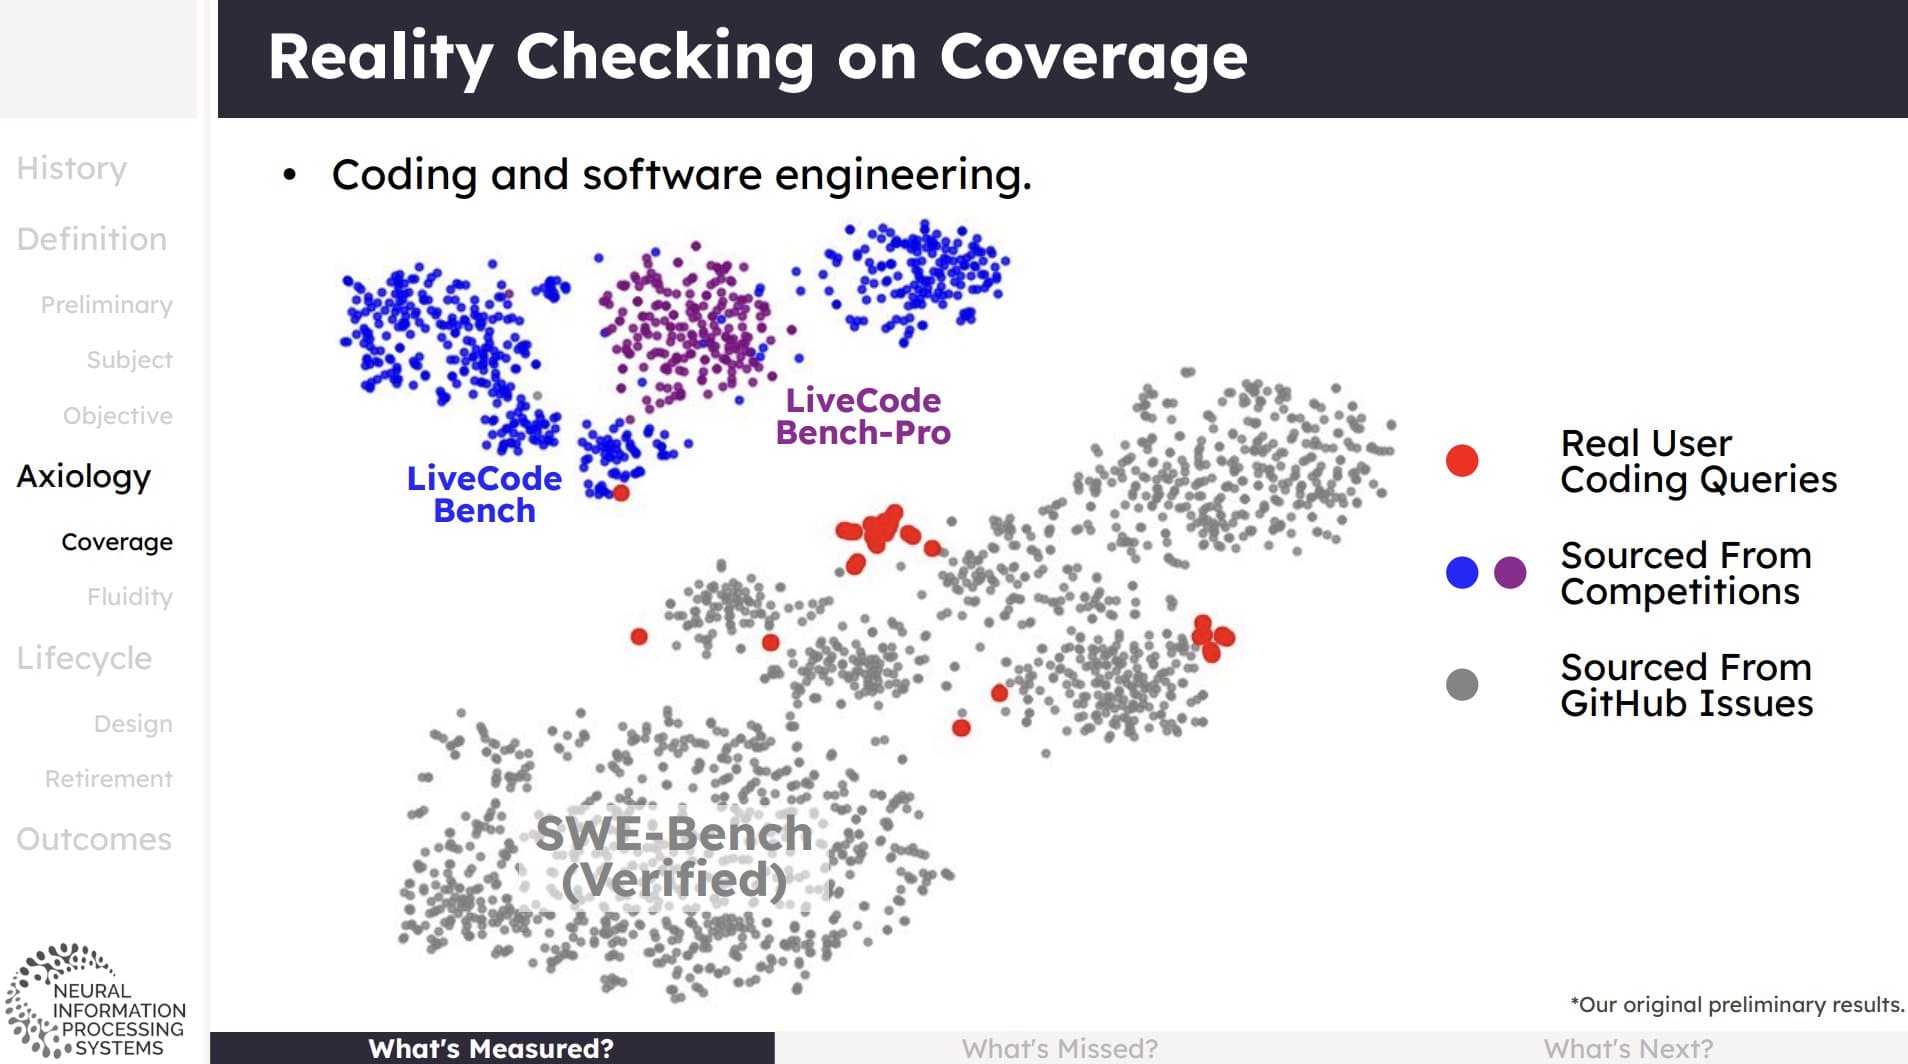
Let
be the distribution of tasks we actually care about.
And let
be the distribution of tasks in our benchmark.
Ideally, if our goal is to estimate performance in the real world, we want the second to tell us something useful about the first.
In the extremely unrealistic perfect world:
Assume we had 100% accuracy on every single query we input. That, my friends, is AGI.
In practice, they are almost never identical. And this is okay, as long as we remember that the score represents the task we use not the ones we care about. The important thing is to know why they are different.
There are plenty of legitimate reasons for the distributions to differ. Safety evals may deliberately oversample rare failures. Frontier benchmarks may select unusually hard problems because normal ones are saturated. A product team may care about one narrow customer population.
I don’t care what’s your reason as long as you do have a reason and are aware! What is not legitimate is making one choice and interpreting the score as if we made another. Claiming your agent is good at math because it solves AIME problems is poor science.
Coverage and difficulty are not the same thing
Coverage:
Does this benchmark represent the space of work I care about?
Difficulty:
Does this benchmark contain tasks hard enough to distinguish the systems I care about?
Going back in time, SimpleQA collected a broad set of language-understanding tasks. Once systems started doing well on it, SimpleQA Verified intentionally selected harder tasks to better distinguish new systems.
So turns out that a benchmark that is useful for ranking frontier models is not automatically useful for predicting what users experience. Hence, the multiple complaints about "bench-maxxing" science.

Tasks are important and basically the basis of every claim we make; so how do we know what my benchmark actually contains?
Read your data.
I am attaching an example on how to do it here:

I know this sounds unsophisticated, but it may be the highest-return thing you can do when working on an eval (or training for that matter).
Before writing a fancy sampling strategy:
read the tasks.
Before computing a confidence interval:
read the tasks.
Before announcing that A beats B:
please, for the love of God:
read the tasks.
Look at random tasks, very easy ones, very hard ones, model disagreements, duplicates, weird formatting, suspicious references, and anything that simply does not look like the capability you thought you were measuring.
And you should not only read the prompt. Read the metadata.
Where did it come from? Who wrote it? Who labeled it? What year was it collected? Was it generated by a model? Was it scraped from Reddit? Was it written by domain experts? [...]
I have countless horror stories from benchmark errors and recycled data surviving for years in heavily used datasets.

You should look not only at whether individual tasks are correct, but whether the sample itself is right for what you are trying to measure. Who decided what belongs in the benchmark? Suppose we build an eval for “good workplace communication.”
Whose workplace? Which language? Which industry? What level of seniority? What counts as “good”? Who wrote the reference answers?
This is sometimes discussed under terms like positionality or axiology. Please read those words as follows:
Somebody made choices about what counts as good behavior.
This is also why domain experts matter, and why companies like Mercor make so much money. Experts are usually better positioned to decide both what counts as a correct label and what behavior is actually worth testing in production.
TL;DR:
Know what you want to measure, and then look at the things you are using to measure it.
We can now finally get to everyone’s favorite part.
Numbers.
How good is 74%?
Suppose we run our benchmark.
Model A passes 74 out of 100 tasks.
So:
Great.
Model B passes 78.
There are at least two questions hiding inside those numbers:
- What exactly got averaged?
- How uncertain is the average?
Let’s start with the first. Imagine our 100-task benchmark contains:
Most of the benchmark is math, so math dominates the overall score even though the category-level story is different.
This is why you should basically never look at only the aggregate. For further reading on this I suggest learning about Simpson’s Paradox.
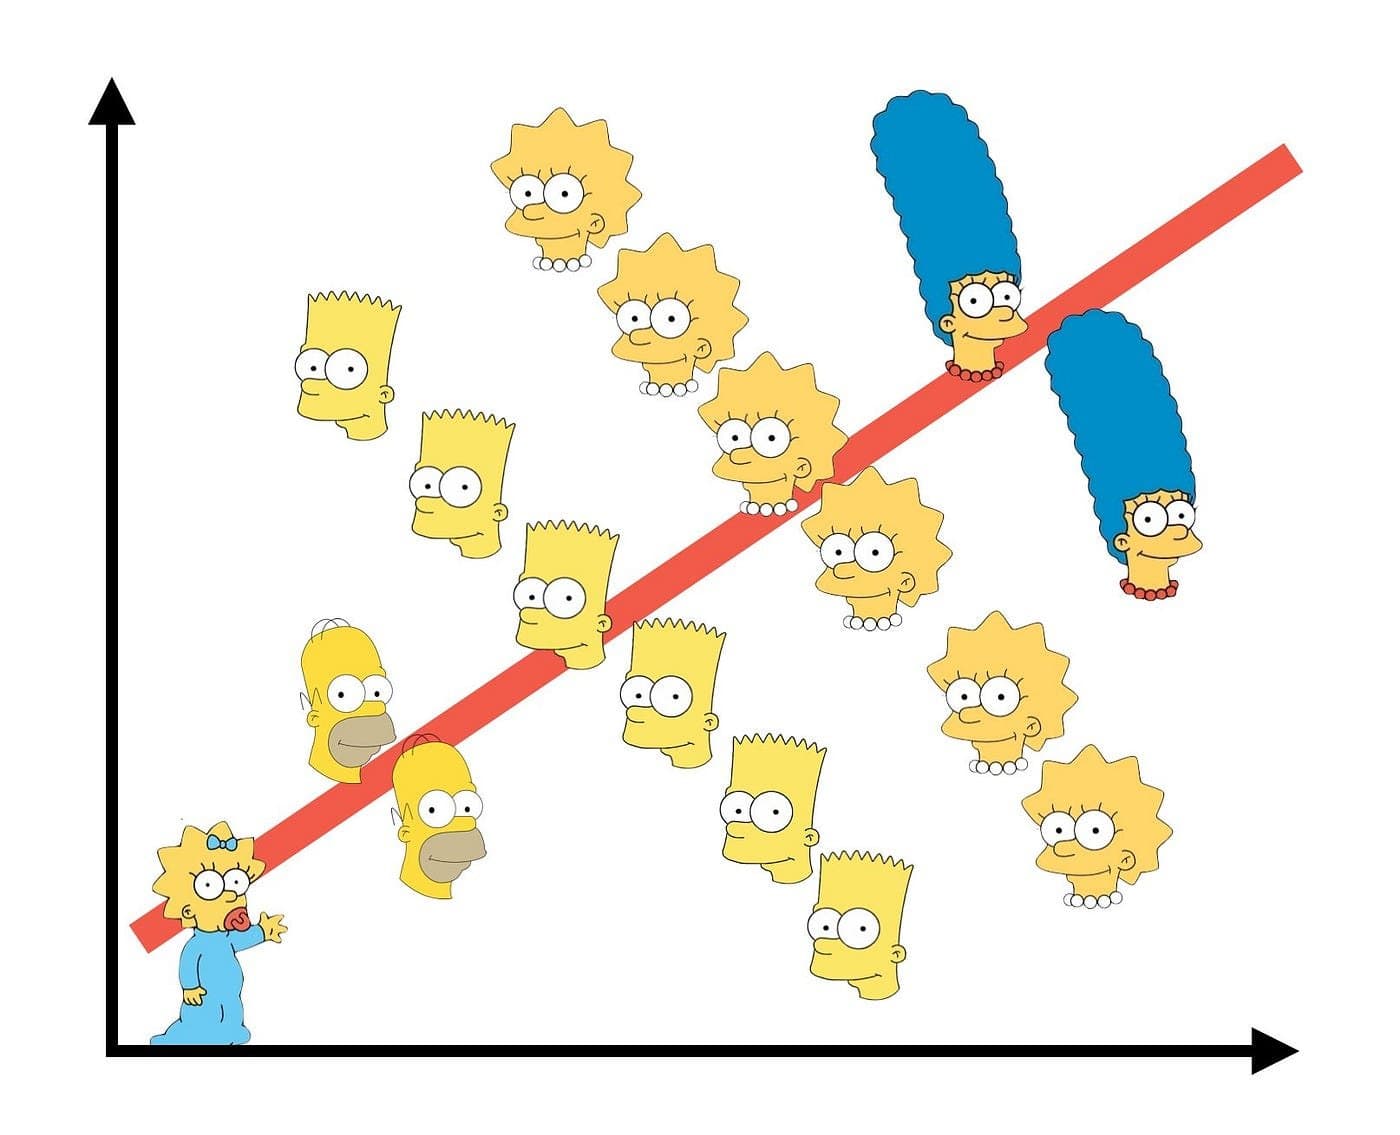
Try to be precise with the type of tasks, and compute slices of the dataset to check where performance comes from.
Some example slices:
task category, source, difficulty, language, customer type, repository, prompt length, required tool, geography, basically any variable that corresponds to a meaningful hypothesis
There is a dangerous version of slicing where you cut the data 900 different ways until you find an exciting result. More in Part II.
An average tells you what happened on average. Your users generally do not arrive as averages.
Ok so our tasks may be better suited to be tracked in different slices. What about the scores?
In the math example above, if every task counts equally, the score is:
This is essentially a micro average. But maybe we care equally about the three categories.
Then:
Same system. Same tasks. Same outputs.
Thus:
Every average contains a weighting decision.
Sometimes the weighting is explicit. Sometimes it is hidden in how many examples happened to be collected from each category.
If your benchmark has 900 Python tasks and 100 JavaScript tasks, then an unweighted task average has already decided that Python matters nine times more.
Maybe that is exactly right. Maybe your product is 90% Python.
Or maybe your scraper was just better at finding Python repositories.
The importance of statistical certainty
Two benchmarks can both report 74% and mean very different things. If one has 20 tasks and the other has 2,000, I trust the second number much more. Why?
Because the benchmark score is an estimate based on a finite sample. If we sampled a different set of 20 tasks, we could get a very different answer.
For a binary pass/fail benchmark, the simplest approximation to the standard error of the pass rate is:
Standard error is roughly how much this estimate would move around if we resampled the benchmark.
As N, the number of benchmark tasks, gets larger, uncertainty shrinks.
One useful interval we tend to get is the the approximate 95% confidence calculated as:
There are better ways to construct intervals, but the basic point is: a score without uncertainty is missing information.
This becomes especially important when people make claims like:
Model B improved by 1%.
Is that signal or noise? You can’t know without measuring the uncertainty around the estimate. Assuming you have a very wide 95% confidence interval, it would be hard to claim it is signal.
In Part II, we will look at paired tests, bootstrap intervals, repeated trials, statistical power, and why comparing two systems on the exact same examples gives us much more information than comparing two isolated means.
Rule of Thumb: Whenever you see a benchmark number, ask how many observations produced it.
74% compared to what?
What is the reference point?
Suppose a model gets 74%. That sounds pretty good. Now I tell you random guessing gets 70%. Less impressive. Or maybe human experts get 76%. Much more impressive.
Or perhaps the benchmark contains enough ambiguous or incorrectly labeled examples that 85% is effectively the meaningful ceiling. Now 74% means something else again. A score only becomes interpretable relative to something.
Useful references can include:
- random performance
- a simple heuristic baseline
- an older model
- human performance
- domain-expert performance
- production performance
- a known ceiling
Be careful with the phrase human performance, by the way.
Which humans? Random Mechanical Turk workers? Undergraduates? Professional software engineers? The people who authored the benchmark?
A benchmark claiming “superhuman performance” because a model beat five tired annotators is perhaps not quite the singularity. Reference population matters.
Save the rows
This is a small practical thing that becomes extremely important later.
Do not only save:
{
    "model": "Model A",
    "score": 0.74
}
Save the task-level results.
Something closer to:
task_id, category, source, system, output, passed, latency, tokens, cost
Why did A beat B? 0.74 and 0.71 cannot tell you. The task-level rows can.
- where A and B disagree
- whether differences concentrate in one slice
- whether grader errors explain the gap
This becomes even more important for agents, where you may also want the entire trajectory.
Aggregate late. Save the raw evidence early.
It is not just the score
By now, ‘Model A: 74%’ should feel almost content-free by itself. A useful result looks more like:
Under system configuration (S), Model A successfully completed 74% of the 500 benchmark tasks sampled from population (P_B), under protocol (Z), according to grader (G).
And then we should add:
- confidence interval
- relevant slice scores
- baselines
- important exclusions
- intended use of the result
Something like:
- Performance on this task distribution under this protocol
Claims not supported:
- Best coding product
- General software-engineering ability
- Performance on production traffic
Can someone else reproduce the number?
Last piece on reproducibility. Suppose I publish:
Our model gets 82.7% on SuperCoolBench.
Okay. People out there need to be able to recreate the number. We trust you, but not that much.
What would somebody else need to know to recreate that number?
At minimum:
benchmark version, task/data version, model version, system prompt, tools/scaffold, evaluation protocol, metric implementation, sample size, random seed, when relevant, task-level results, evaluation date
BetterBench evaluated benchmarks across a much broader lifecycle and found, among other things, that many benchmarks did not make results easy to reproduce or report statistical significance consistently.
Reproducibility is both a data problem and a system problem. A great dataset attached to an undocumented evaluation script is not a great measurement instrument.
Neither is a leaderboard where the model name is visible but nobody knows which prompt, sampling parameters, scaffold, or grader version produced the number. This leads to different people using different conventions, typically the convention that helps the company make the best business statement.
This will become much more important later in the series when we talk about benchmark versions, contamination, grader changes, and living evals.
For now, a decent rule is:
If changing something could plausibly change the score, record it.
What did we learn?
A benchmark compresses a large measurement process into something we can reason about quickly.
When you see:
Model A: 74%
try to mentally expand it into:
74% verified success on a particular sample from a particular task population, under a particular system configuration and protocol, using a particular grader and aggregation rule, with some amount of uncertainty.
The main ideas I want you to leave Part I with are:
A benchmark is a measurement instrument, not a capability.
The score belongs to the system and protocol that produced it.
The benchmark is a sample from some larger task population.
Every metric contains choices about what gets counted and how it gets weighted.
Read your data.
The job of benchmarking is to make the second useful evidence about the first.
So far, however, we made a lot of assumptions.
- We assumed the data is correct.
- We assumed the grader works.
- We assumed the model did not see the benchmark during training.
- We assumed two leaderboard submissions were compared fairly.
- We assumed the difference between 74 and 78 is actually meaningful.
- We assumed the benchmark still measures today what it measured when it was created.
Those are some extremely optimistic assumptions.
In Part II, we are going to break them.
Sources
A few papers and resources that shaped the examples and ideas in this piece:
- NeurIPS 2025, The Science of Benchmarking: What’s Measured, What’s Missed, and What’s Next. Big ispiration and incredible learning material on modern benchmarking practice and evaluation methodology.
- Jimenez et al. (2024), SWE-bench: Can Language Models Resolve Real-World GitHub Issues?. A useful example of moving from small coding problems toward repository-level tasks grounded in real GitHub issues.
- Wei et al. (2024), Measuring short-form factuality in large language models. Introduces SimpleQA and is a good example of designing an eval around a narrow, explicit capability: short-form factuality.
- Haas et al. (2025), SimpleQA Verified: A Reliable Factuality Benchmark to Measure Parametric Knowledge. Revisits SimpleQA by filtering noisy labels, reducing redundancy, balancing topics, and improving the grading setup.
- Humanity’s Last Exam (2025), arXiv:2501.14249. Used in the article as an example of deliberately difficult frontier evaluation.
- Reuel et al. (2024), BetterBench: Assessing AI Benchmarks, Uncovering Issues, and Establishing Best Practices. A broader look at benchmark quality across design, implementation, documentation, and maintenance.
- Lin et al. (2014), Microsoft COCO: Common Objects in Context. One of the dataset examples referenced when discussing data quality and annotation.
For the statistical concepts used throughout, useful starting points are confidence intervals, confounding, and Simpson’s paradox. Simpson’s paradox in particular is a useful reminder that an aggregate score can tell a very different story from the groups underneath it.
I also recommend going directly to benchmark datasets, task-level results, evaluation code, and model cards whenever they are available.